Guide
Get around the capacity grid
The capacity grid is where most planning happens: rows are sites, grouped by region, and columns are months. This page covers the controls around the grid — moving through time, changing what you can see, moving a placement with the mouse or the keyboard, and printing the result for a meeting.
What you are looking at
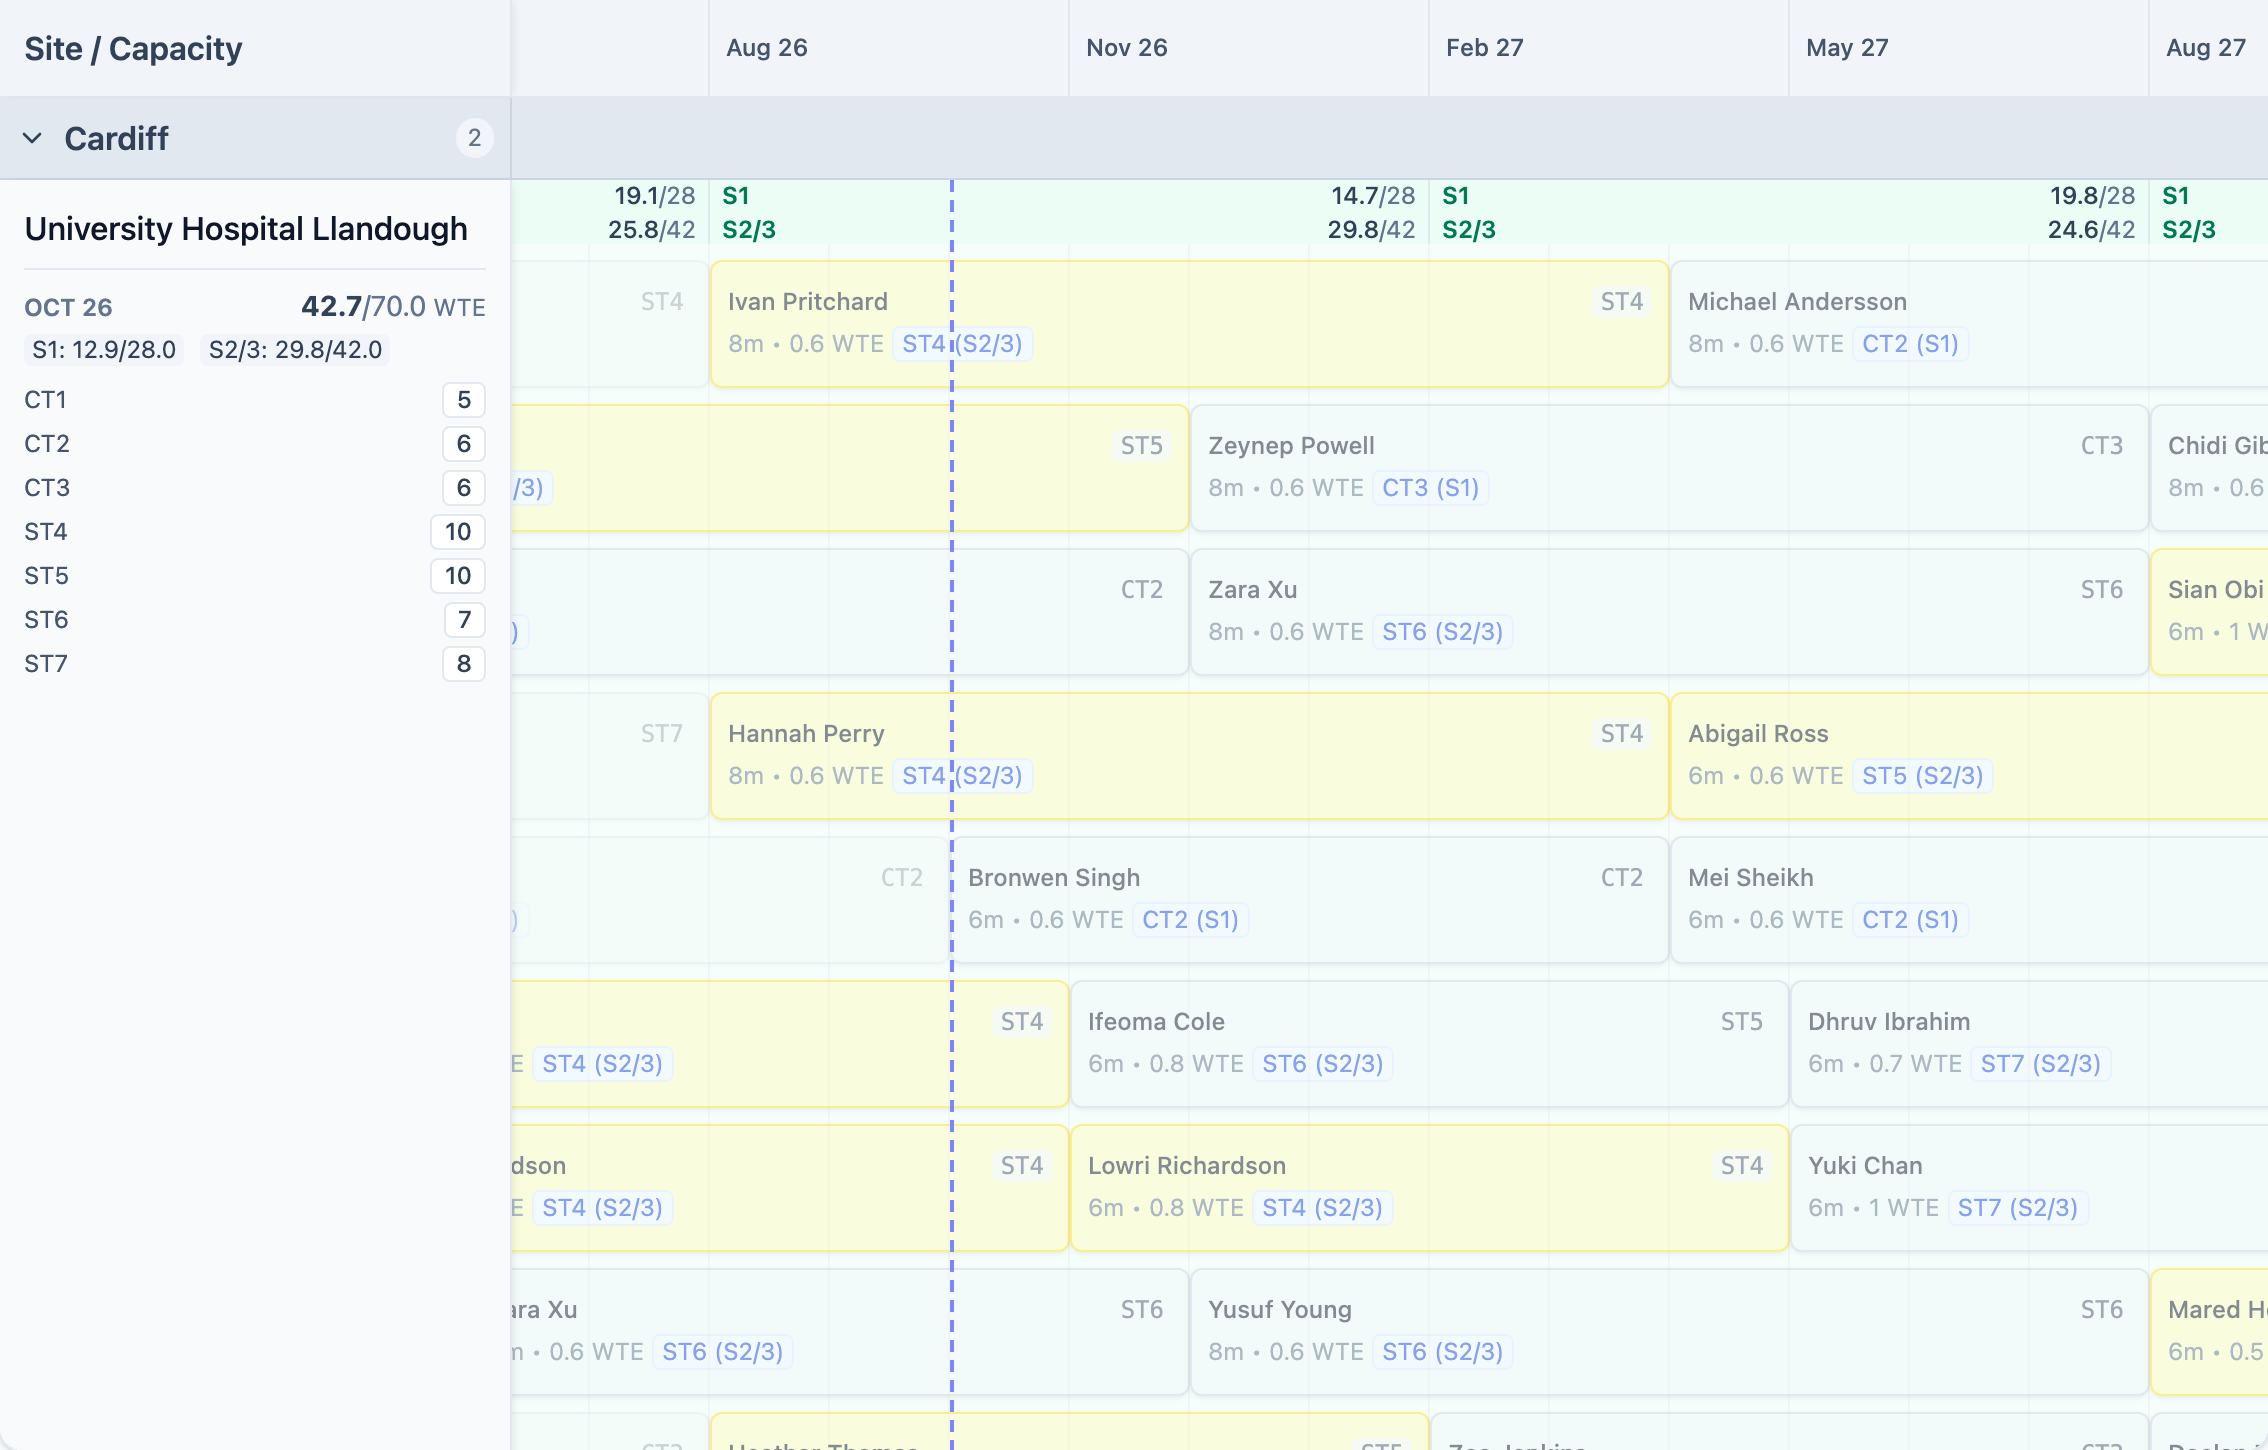
Each bar on the grid is one placement: a trainee at a site, for a run of months. Selecting a bar opens that trainee's record, where you can edit the placement precisely.
- Placements are drawn per site row, so one trainee's programme reads as a sequence across several rows.
- What you can edit depends on the planner mode in the header. In
Testingyou are changing a scenario, not the live plan.
Move through time
Four zoom levels set how much of the timeline fits on screen. Use the - and + buttons in the toolbar above the grid; the label between them shows where you are. The grid keeps its zoom level when you go to another tab and come back. When you reload the page, it goes back to Quarter.
Year— the widest view, for spotting shape and pressure across years.6 MonthsQuarterMonth— the closest view, where month labels and per-cell figures are readable.
The grid opens on the current month and then stays where you put it. Opening and closing a trainee dialog or the print view does not move it. To get back to the current month deliberately, use the crosshair button (Scroll to today) in the header.
Understand the visible range
The grid does not show every month you have data for. The visible range is limited to a window around today — five years back and seven years forward — so the grid stays fast as a programme's history grows.
The bar directly above the grid always states what is happening:
Showing <first month> – <last month>— the range currently drawn.N earlier placements hiddenandN later placements hidden— real records that exist outside the window. If a placement is not on screen, this is the first thing to check.Load 2 more years earlierandLoad 2 more years later— widen one edge at a time. The buttons appear only when there is something hidden at that edge.
- Clamping only ever narrows. A programme with two years of data shows two years; it is not padded out to twelve.
- If your programme has an explicitly configured timeline start year, that wins over the five-year floor.
Change the density
The compact-view button in the header (Compact view — shorter block rows) reduces row height so more of the plan fits on screen. It is a display setting only — nothing about the plan changes — and it applies instantly, however large the programme is.
Hide the capacity strip
Each site row starts with a thin capacity strip. It shows the used and total WTE for each capacity group in each rotation window, for example S1 12.9/28. The panel button in the header (Show capacity strip) hides or shows it. When the strip is hidden, the placements move up and each row is shorter. The site column on the left still shows the capacity for the selected month.
The grid keeps your choice in this browser, so the strip stays hidden after a reload until you turn it on again.
Read the grid legend
A placement always has the colour of its curriculum stage. The legend above the grid shows the marks that go on top of that colour:
- Overlap — a red outline and a red circle icon. Two placements for the same trainee cover the same month. Both placements get the mark. A finished placement that runs into a current one counts.
- Gap after — an amber outline and an amber triangle icon. The trainee has unplanned months straight after this placement. Only that placement gets the mark, not every placement of the trainee.
- Past overlap and past gap — a faded, dashed red or amber outline and a faded icon. Two finished placements overlap, or a gap is fully in the past. The grid shows these marks only when the overlap or gap check has
Also flag past placementson inProgramme Setup. They are off by default.
- Over capacity — a light red tint behind the month cells where the site holds more WTE than its capacity.
The icon sits after the grade in the placement's name line. A placement can have both marks. Hover over a placement, or focus it with the keyboard, to read the problem in words.
Hide trainees who have completed CCT
By default, placements belonging to trainees with status CCT Complete are hidden, because they are finished and would otherwise crowd the plan permanently. The graduation-cap button in the header toggles them back into view.
- The CCT-complete toggle and the grade, region, stage and search filters are view filters only. Capacity, utilisation, validation and reports always count every placement, because capacity is a property of the site and bucket, not of what you are currently looking at.
- So a site can look under-used on screen while its capacity figures say otherwise. That is the filters working as intended, not a discrepancy.
See capacity pressure with the heatmap
The heatmap button in the header (Toggle capacity heatmap) shades each site-month by how much of its capacity is used, so shortage and over-capacity patterns are visible without reading any numbers. A legend appears under the grid whenever the heatmap is on:
- green — 1–79% used
- amber — 80–100% used
- red, striped — over capacity
Hover over a month cell, or focus it with the keyboard, to read its current/capacity figures for each capacity group.
Move a placement with the mouse
- Open
Capacity Gridand confirm the planner mode in the header is the one you intend to edit in. - Drag the placement to a new site row or a new month.
- Drop it. A drop that lands back on the placement's own month and site counts as no change, and records nothing.
- Check the validation badge in the header for any overlap or capacity warning the move introduced.
- A drag moves only that one placement. The trainee's other placements stay where they are, so a drag can open a gap or make an overlap. The grid marks it, and
Resolvein the trainee record fixes it. - To move a placement and everything after it, edit it in the trainee record instead. The Edit form asks what happens to the later posts.
- The confirmation message after a drag offers
Undo.
Fold the region groups
Each region on the grid has a header that folds its sites away. Collapse all and Expand all, in the toolbar above the grid, fold or open every region at once. They act only on the regions the current filters show.
Move a placement with the keyboard
The grid is fully operable without a mouse, and every step is announced to a screen reader.
Tabto a placement, then pressEnterorSpaceto pick it up. The app announces the trainee, the start month, and the keys available.- Use the arrow keys. Left and right move by exactly one month per press; up and down move by one row per press — regardless of where the placement sits on screen or how fast you press.
- Press
Spaceto drop. The app announces the new month and site. - Press
Escapeto cancel and leave the placement where it was.
The grid scrolls to follow the placement when you move it past the visible edge.
Print the grid
Print view in the toolbar above the grid opens a print preview for a date window of your choosing — useful when the plan has to go into a meeting pack on paper.
- Select
Print viewin the grid toolbar. - Set
FromandToto the months you want on the page. The preview opens on the current training year by default. - Optionally narrow to a single region.
- Optionally narrow to a single capacity group.
All capacity groupsprints a row per site and group; picking one group prints that group alone. - Check the preview, then select
Print. - Select
Closeto return to the grid, which stays on the month you left it on.
Each cell reads used / capacity for one site, one month and one capacity group — the same figures the grid shows for that group. A ! marks a group over its capacity, a ~ marks one at 90% or more of it, and ∞ means the site has no capacity limit set.
- Capacity counts every placement in the programme, not just the ones currently on screen. Filtering the grid, or hiding CCT-complete trainees, does not change the printed figures.
- This prints the capacity grid. To print a report instead, use
Print Report (PDF)inReports & Gaps.
Next steps
The TPD guide covers what to do with the plan once you can navigate it — building it, validating it, and reporting on it.